A genogram is more than just a family tree; it’s a powerful tool for visualizing relationships and patterns within families. By mapping out connections across generations, it reveals insights into emotional ties, health issues, and behavioral trends. This visual representation helps professionals in various fields, from psychology to social work, understand complex family dynamics.
As individuals seek to unravel their family histories or address personal challenges, genograms provide clarity and a deeper understanding of how family influences shape lives. With its unique blend of art and science, this tool fosters communication and healing, making it invaluable for anyone looking to explore their roots or navigate family-related issues.
Understanding Genograms
Genograms provide an intricate view of family relationships and patterns, extending beyond the simplicity of a family tree. They encompass emotional connections, health issues, and behavioral trends across generations.
Definition and Purpose
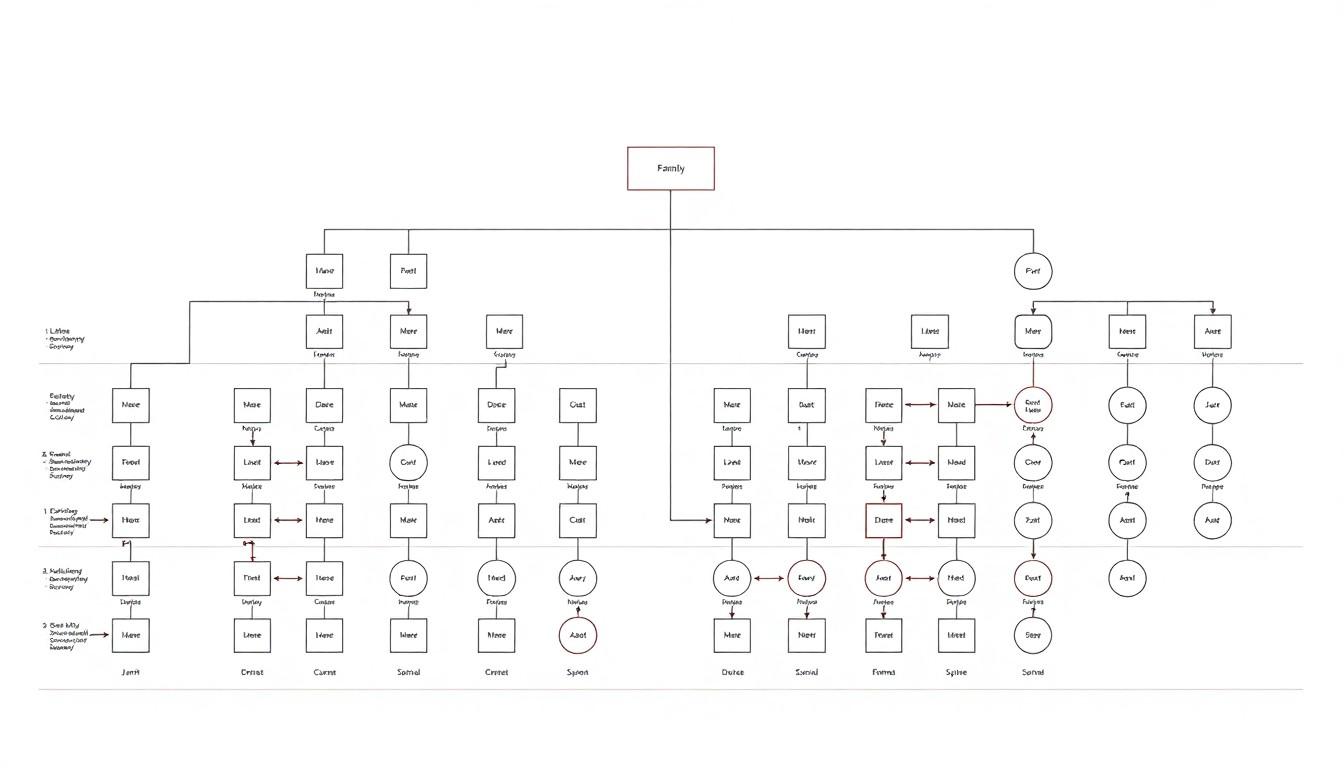
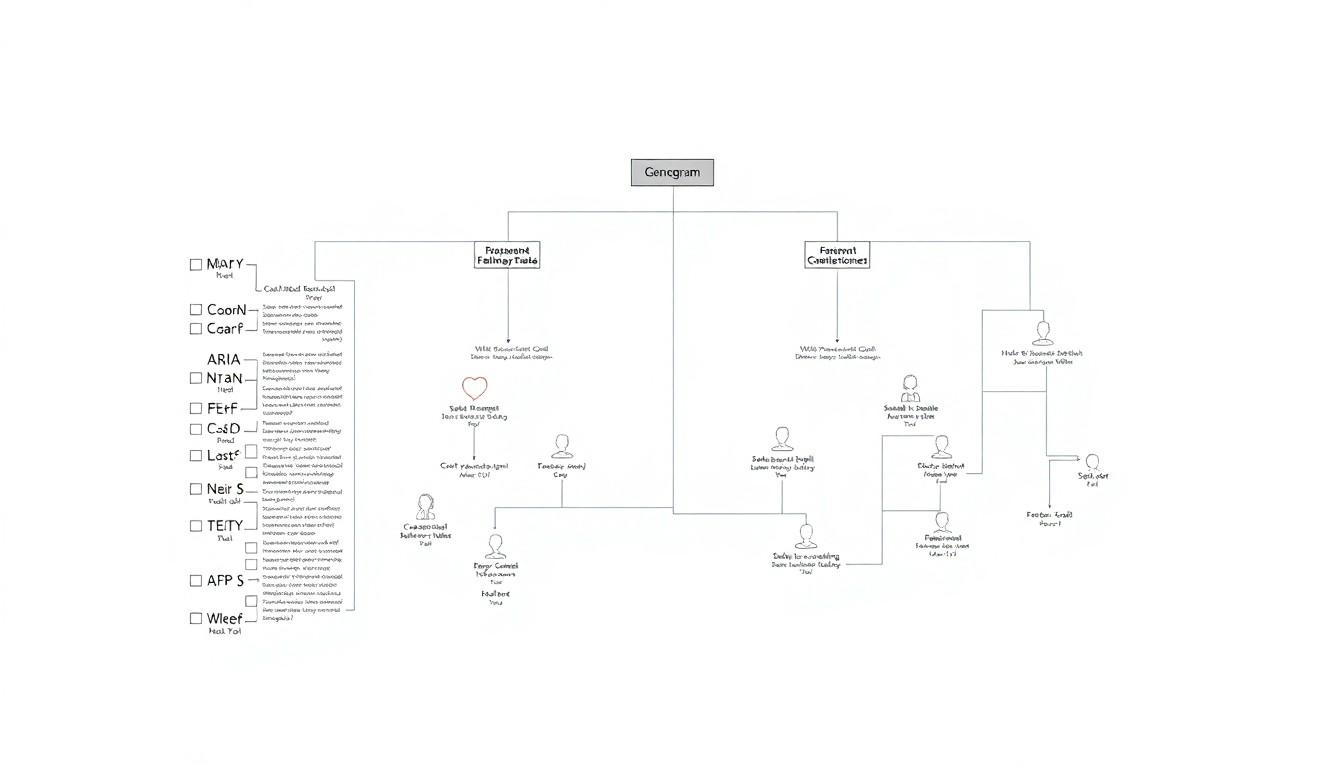
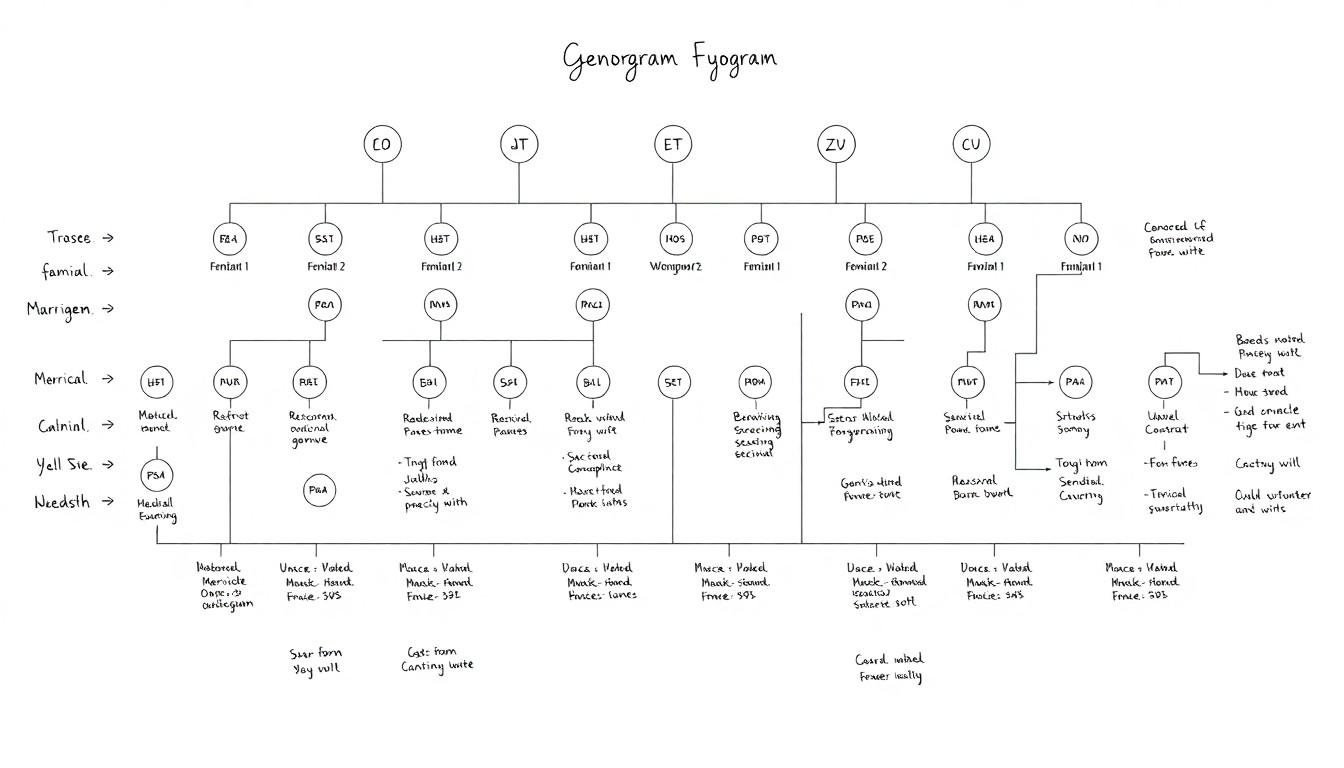
A genogram, often referred to as a family diagram, visually represents an individual’s role within their family’s hereditary and ongoing relationships. Genograms utilize simple symbols—squares for males, circles for females, and additional symbols for non-binary or transgender individuals—to illustrate diverse family connections. This tool includes comprehensive information such as names, birth and death dates, current ages, medical histories, and significant life events. By documenting behavioral and health issues like substance abuse and mental health conditions, genograms highlight the complexities of family dynamics, aiding in the understanding of common patterns and challenges.
Importance in Various Fields
Genograms play a crucial role in multiple fields, including psychology, social work, and healthcare. In psychology, professionals use genograms to identify unhealthy patterns, assess family dynamics, and facilitate therapeutic conversations. In social work, they assist in developing effective intervention strategies by clarifying the relationships influencing individual clients. Healthcare providers utilize genograms to gather information on hereditary health conditions, guiding preventive care and treatment. Overall, genograms equip practitioners with valuable insights, enhancing their ability to address unique needs within families.
Components of a Genogram

A genogram features essential components that provide in-depth insights into family relationships and dynamics. Understanding these components enhances the overall utility of this tool.
Basic Structure
- A genogram includes names, genders, dates of birth, and dates of death of family members, often spanning multiple generations.
- The structure typically starts with the oldest generation at the top and proceeds downward through succeeding generations.
Symbols and Notations
- Males are represented by a square, while females are represented by a circle.
- A horizontal line connects married couples without distinguishing between civil and religious marriages.
- Separation is indicated by a single oblique bar, and divorce is represented by a double oblique bar.
- Biological/natural children, adopted children, and foster children are clearly distinguished by unique symbols.
- Relationships among family members illustrate various dynamics, such as marriage, divorce, and parentage.
- Emotional connections, including significant life events, can be represented to reflect deeper family ties.
- Medical histories and behavioral trends can be incorporated to highlight hereditary patterns.
- Various generations create a comprehensive timeline that documents changes within family structures over time.
Applications of Genograms

Genograms serve various purposes across different fields, particularly in understanding family structure and dynamics. Their detailed visual representation of relationships and histories enhances assessments and interventions.
Family Therapy
Genograms are crucial in family therapy, enabling therapists to visualize emotional connections among family members. They illustrate relationship dynamics such as marriages, separations, and significant life events. This visual clarity helps therapists consider the emotional ties that may affect family interactions and individual behaviors. Furthermore, genograms assist in identifying generational patterns, such as inherited psychological factors and familial trauma, leading to tailored therapeutic approaches.
Medical History
Genograms play a vital role in documenting family medical histories. They provide a graphic overview of hereditary health conditions, allowing healthcare professionals to offer preventive care. By mapping out health issues across generations, genograms aid in identifying risks and informing treatment strategies. For instance, a genogram can highlight patterns of conditions like heart disease, diabetes, or mental health disorders, enabling targeted interventions to minimize potential health risks.
Education and Social Work
In education and social work, genograms are instrumental for developing effective intervention strategies. They clarify relationships influencing clients and highlight social factors impacting educational performance or well-being. Social workers utilize genograms to assess familial support systems and resource availability. In educational settings, teachers can gain insights into student backgrounds, informing approaches to address unique challenges. By visualizing family structures, genograms enhance understanding and promote effective communication among all parties involved.
Creating a Genogram

Creating a genogram involves a systematic approach that reveals intricate family dynamics and historical patterns. The process consists of several essential steps and may utilize various tools and software options for effective representation.
Step-by-Step Process
- Gather Information:
Collect comprehensive data on family members, documenting names, ages, relationships, and significant life events such as marriages, divorces, and deaths. Include pertinent details about medical histories, mental health issues, and substance use to provide context and depth. - Choose Symbols and Notations:
Utilize standardized symbols to represent different relationships and events. For example, squares denote males, and circles represent females. Different lines indicate various relationship types, including solid lines for marriages and dotted lines for friendships. - Sketch the Genogram:
Begin with the oldest generation at the top of the diagram and work downward. Arrange family members logically, ensuring that relationships are clearly displayed. Use symbols and lines to illustrate connections accurately. - Add Details:
Include relevant details about each family member, such as birth and death dates, chronic illnesses, and noteworthy life events. Capture emotional connections and behaviors by using additional annotations, enhancing the genogram’s utility. - Analyze the Genogram:
Review the completed genogram to identify patterns related to health, behavior, and relationships. Examine trends across generations, such as hereditary medical conditions and recurring conflicts, to gain insights into family dynamics.
Tools and Software Options
Several tools and software programs facilitate the creation of genograms, enhancing accuracy and efficiency:
- Genogram Analytics: A specialized software offering comprehensive features for creating and analyzing genograms in a professional context, particularly useful for therapists and social workers.
- Family Tree Builder: A user-friendly program enabling users to create visual family trees and genograms, making it accessible for individuals interested in exploring their ancestry.
- Lucidchart: A versatile online diagram tool that supports genogram creation with customizable templates and easy collaboration features, suitable for educators and family therapists.
- GenoPro: A software designed specifically for creating detailed genograms, including advanced features to illustrate medical history and complex relationships effectively.
These tools streamline the genogram creation process, allowing users to focus on uncovering and interpreting familial patterns and relationships.
Conclusion
Genograms are powerful tools that provide a deeper understanding of family dynamics and relationships. By visually mapping out connections and documenting significant life events, they reveal patterns that can influence behavior and health across generations.
Their application spans various fields including psychology, social work, and healthcare, making them invaluable for professionals seeking to enhance their understanding of clients’ backgrounds.
With the aid of modern software, creating a genogram has become more accessible, allowing individuals and practitioners to explore family histories effectively. This exploration not only fosters communication but also encourages healing and personal growth, ultimately enriching the lives of those involved.


